
Last Updated: November 8, 2026
Quick Summary
Solar battery data logging is the continuous recording of how your solar panels, battery and home loads behave over time. Comparing those signals shows when your battery sits full while you buy grid power, letting you cut bills.
- Track solar generation, battery state of charge, grid import and export, and household consumption together.
- Check inverter and battery compatibility before buying a logger, and confirm it can read your meter.
- Read generation against consumption, and battery level against grid flow, to spot savings or faults.
- Shift large appliances into midday, when panels are producing, to free the battery for the evening.
Table of Contents
- What Solar Battery Data Logging Records and Why It Matters
- Choosing a Logger That Works With Your Inverter and Battery
- Step-by-Step: Setting Up Your Solar Battery Data Logger
- Reading Your Data: Solar Battery Monitoring Worked Examples
- Tracking Solar Self-Consumption to Lift Your Savings
- Using Energy Consumption Data Logging to Shift Household Loads
- Keeping Your Data Private and Your Monitoring Running
- Booking a GridFree Solar Review of Your Logged Data
- Frequently Asked Questions
What Solar Battery Data Logging Records and Why It Matters
Solar battery data logging is the continuous recording of how your solar panels, battery and home loads behave over time. Without it, most households only see a monthly bill and have no idea why it moved. With it, you can see exactly when your battery charges, when it empties, and when you buy power from the grid you could have covered yourself.
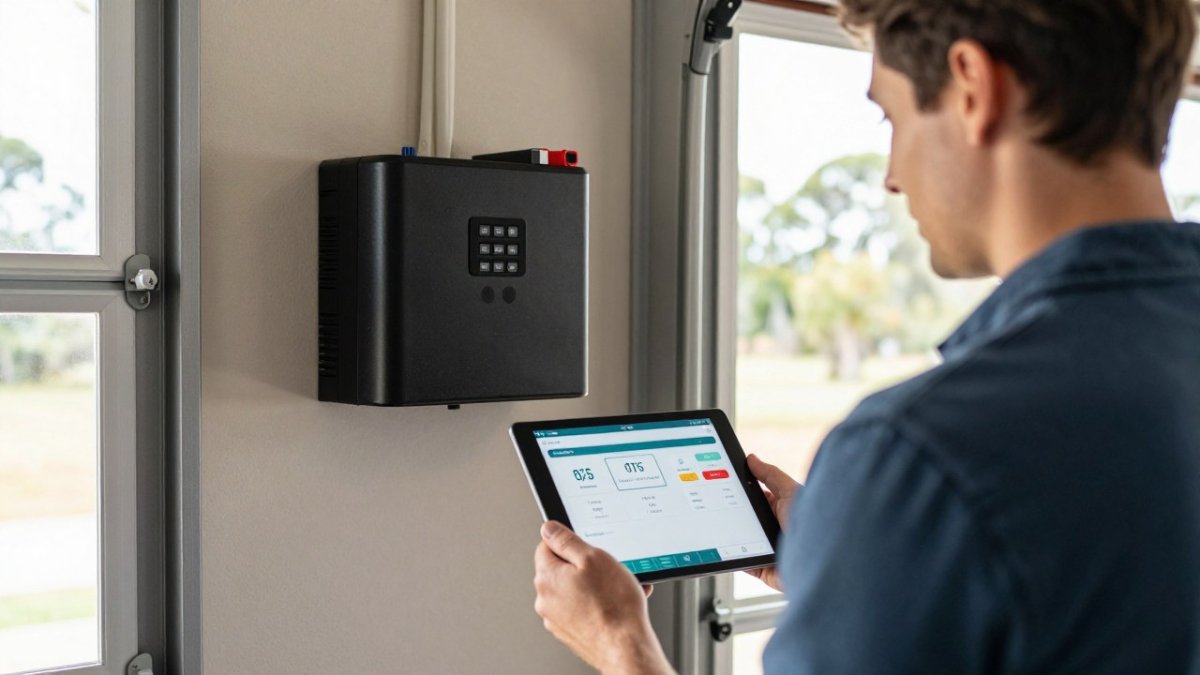
Owners who check their logged data often find savings they had missed. The logger records a few core signals:
- Solar generation: how much your panels produce, usually in kilowatt-hours (kWh) per interval
- Battery state of charge: how full the battery is at any moment
- Grid import and export: power pulled from the grid and power sent back to it
- Household consumption: what your home uses across the day
The value comes from comparing these together. A battery that sits at full charge while you import grid power at 7pm is a clear sign that your settings are costing you money. Data makes that visible in minutes instead of after a year of bills.
Choosing a Logger That Works With Your Inverter and Battery
Not every logger talks to every system, so compatibility comes first. Check three things before you buy: whether the logger supports your inverter brand and model, whether it can read your battery’s own data, and whether it can read your meter. A logger that reads only solar generation will tell you far less than one that also tracks the battery and grid flows.
The Best Solar Battery Monitoring Systems 2026 guide compares the main options side by side, which helps when you are narrowing down hardware. Pay attention to whether your hybrid inverter exposes battery data through an open protocol, because that decides how much you can record locally.
A common mistake is buying a logger that only works through the manufacturer’s app. That setup can leave you with gaps in your history if the cloud service changes or goes offline. Look for local recording with an option to export the data as a file.
Step-by-Step: Setting Up Your Solar Battery Data Logger
Follow these steps in order:
- Confirm the connection. Check the inverter’s communication port and the logger’s cable type before you start.
- Install the logger. Mount it near the inverter, out of direct sun, with the network connection in reach.
- Pair the battery and meter. Enter the battery model and meter details so the logger reads the right registers.
- Set your time zone and clock. Wrong timestamps make it impossible to match data to your bills.
- Run a test day. Watch the live readings for one full day and check that every signal shows a sensible value.
- Set your logging interval and retention (covered below).
- Save a copy of the setup. Record the IP address, login details and firmware version somewhere safe.
Choosing logging intervals and data retention
Shorter intervals give finer detail but create far more data. Before you judge a battery’s readings, learn how depth of discharge changes the numbers you see. Five-minute intervals work well for spotting when the battery charges and discharges. Fifteen-minute intervals are usually enough for bill analysis and keep storage small. Keep your history for at least twelve months so you can compare the same season across two years.
Watch out: if your logger overwrites old data after a few weeks, you lose the seasonal comparison that makes the data useful. Check the retention setting before you walk away.
Reading Your Data: Solar Battery Monitoring Worked Examples
Raw numbers are only useful when you know what to look for. The fastest way to build that skill is to read your logger’s daily chart in a fixed order: generation first, then household consumption, then battery state of charge, then grid import and export. When those four lines disagree, you have found either a savings opportunity or a fault.
Example 1: the late-evening grid import. Your battery reaches 100 per cent at 2pm, but the logger shows grid import between 6pm and 8pm while the battery is still at 90 per cent.
Example 2: the midday export. Your panels export 4 kWh between 11am and 2pm while the battery sits idle at 60 per cent. On the chart, generation is high, consumption is low, the battery line is flat, and the export line spikes. That energy is being sent to the grid at a low feed-in rate instead of being stored for the evening. Check your depth-of-discharge setting and your charge schedule: if the battery is being held back from charging during the day, it will have nothing to give at night. The saving is the difference between the feed-in rate you received and the retail rate you will pay for that same energy after dark.
Example 3: the seasonal comparison. Pull the same week from summer and winter and put the daily charts side by side. A common pattern is high self-consumption in summer and a sharp drop in winter, when generation falls but heating load rises.
Example 4: the standby load that never sleeps. Look at the consumption line between midnight and 5am, when the house should be quiet. A flat baseline of a few hundred watts is normal for fridges, routers and standby devices.
Read the data in pairs: generation against consumption, and battery level against grid flow. Any time the two disagree, you have found a savings opportunity or a fault worth investigating. Tracking each adjustment alongside grid flow makes it easier to spot patterns across the home, and Gadgetry can help you connect those readings with broader energy habits.
Tracking Solar Self-Consumption to Lift Your Savings
Self-consumption is the share of your solar energy that your home uses directly or stores in the battery, rather than exporting. The higher that share, the less you buy at retail rates and the less you sell back at lower rates. For a fuller set of steps to lift your savings, see how to maximize solar battery savings.
Start by writing down the three rates on your bill: the daytime or off-peak import rate, the peak import rate, and the feed-in rate you receive for export. Then use your logged data to split each day into three buckets, solar used on site, solar stored and used later, and solar exported. The value of each bucket is different. Energy you use on site avoids the import rate you would otherwise pay.
A common pattern is a household with a battery that still exports heavily in the middle of the day. The logger shows generation and export rising together while the battery line stays flat or climbs slowly.
Load shifting works alongside the battery. Run the dishwasher, washing machine and pool pump during the middle of the day when generation is high, and the battery is freed to cover the evening instead.
Watch out: a self-consumption figure can look healthy while the battery is doing very little, because the house is simply using solar in the daytime. Check the battery’s daily throughput as well as the self-consumption percentage, or you may miss a battery that is idle through the hours it should be working.
Review the figure monthly for the first year and compare the same month across two years once you have the history. Small changes add up, and the monthly view shows whether each change actually moved the number or just felt like it should have.
The article’s three-bucket split shows where each kilowatt-hour of solar earns its value.
| Energy bucket | Value to you | Why |
|---|---|---|
| Used on site | Avoids import rate | Replaces grid power you would buy |
| Stored, used later | Avoids peak rate | Covers the evening peak, usually the highest rate |
| Exported | Feed-in rate only | Typically the lowest value on the bill |
Using Energy Consumption Data Logging to Shift Household Loads
Consumption data tells you which appliances drive your bill. Log your household load for a few weeks, then look for the peaks. Most homes see a spike in the early evening when cooking, heating or cooling and laundry overlap.
Shifting even one large load out of that window can make a visible difference. Run the washing machine or dishwasher in the middle of the day when your panels are producing, and the battery can cover the evening instead. Pair this with a smart timer if your system supports one.
Monitoring also catches problems. A load that suddenly runs longer than usual, such as a faulty fridge or a pump that never switches off, shows up as an unexplained rise in consumption. Catching it early saves money and avoids damage.
Keeping Your Data Private and Your Monitoring Running
Your energy data reveals when you are home, when you sleep and when you cook, so treat it as private information. Protect your logger the same way you protect your router and your email.
- Change the default password on the logger and the inverter before connecting them to your network.
- Keep firmware up to date so known security issues are patched.
- Use a separate Wi-Fi network for devices like inverters and loggers, away from laptops and phones.
- Choose local storage where you can. Local recording keeps your history on your site even if a cloud service fails.
Schedule a check every three months. Confirm the logger is online, the data is arriving at the expected interval, and the battery readings look normal.
Booking a GridFree Solar Review of Your Logged Data
Once you have a few months of data, the patterns are clear, but reading them well takes practice. GridFree Solar offers a review of your logged data to help you spot the biggest savings and check that your battery settings match how you use power. If you would like a second set of eyes on your numbers, book a GridFree Solar review of your logged data and we will walk through what your system is really doing.
Frequently Asked Questions
What data should I track from my solar battery system?
Track battery state of charge, battery voltage and charge and discharge power, solar panel generation, grid import and export, and household consumption. Together these show whether your battery is charging from solar or the grid, how much you export, and when your home draws the most power. Logging these values at regular intervals gives you a baseline, so you can spot underperformance early and check whether changes to your routine are reducing what you pay for electricity.
How often should I check my solar battery monitoring data?
A weekly check is enough for most households, with a more detailed review each month or after any change to your tariff, appliances or usage habits. Look for sudden drops in generation, unexpected grid imports during sunny periods, and battery charge that never reaches full. Set alerts in your monitoring app for faults so you do not need to check constantly. If you see a pattern you do not understand, contact GridFree Solar for a review.
Can data logging show whether my battery is charging from solar or the grid?
Yes. When generation exceeds household consumption, the battery should charge from solar and grid import should be near zero. If grid import is high while panels are producing, or the battery charges overnight at a time you did not set, the data will show it. Comparing battery charge power against solar generation and grid import at the same timestamps makes the source of charging clear, and points you to settings that may need adjusting.
What is the difference between a solar monitoring app and a data logger?
A monitoring app shows you current and summary figures from your inverter or manufacturer’s cloud service, usually with limited history. A data logger records measurements at set intervals and stores them over time, often locally, so you can export and analyse them yourself. A logger is more useful for finding long-term trends, comparing bills against usage and checking battery degradation. Many households use both: the app for daily checks, the logger for the detailed record.
