
Last Updated: October 28, 2026
Quick Summary
You can monitor home energy use by checking the half-hourly smart meter data your electricity distributor records, which your retailer portal often displays. Add a real-time whole-home monitor for live tracking, and use plug-in monitors to measure individual appliances.
- Your electricity distributor, not your retailer, collects the half-hourly smart meter readings.
- Download the CSV from your retailer portal to spot evening peaks and overnight baseload.
- A whole-home monitor tracks live usage, while plug-in monitors measure single appliances.
- Multiply kWh in each tariff window by its rate to find where your money goes.
- Check solar generation in your inverter app and export in your retailer portal.
Table of Contents
- Why Monitoring Your Home Energy Usage Matters in Victoria
- Step 1: Check Your Smart Meter Electricity Usage Data
- Step 2: Install a Home Energy Monitor for Real-Time Tracking
- Step 3: Measure Individual Appliances With Plug-In Monitors
- Step 4: Monitor Solar Power Usage, Export and Batteries
- Turning Kilowatt-Hours Into Dollars and Acting on Your Data
- Booking a GridFree Solar Energy Review for Your Home
- Frequently Asked Questions
Why Monitoring Your Home Energy Usage Matters in Victoria
Monitoring your home energy use, which you can start doing today, shows you exactly where your electricity goes. Most households have no idea which appliances drive their bills, and that gap costs money every month. Once you can see your usage patterns, you can cut waste and decide whether solar or a battery makes sense for your home. Once you know where electricity is being used, smart home devices can help make everyday energy choices more visible, a topic explored by Uniq Trenz.
This guide walks you through four practical steps. You will learn how to read your smart meter data, add a real-time monitor, measure single appliances, and track solar, export, and battery activity.
Victorian homes use electricity in very different ways. A house with an electric hot water system and reverse-cycle air conditioning will have a very different profile from a small flat. Reading your own data is the only reliable way to know which group you fall into.
- Spot your biggest energy costs by time of day
- Compare usage across seasons
- Check whether a solar system is performing as expected
- Decide if a battery would actually save you money
Step 1: Check Your Smart Meter Electricity Usage Data
Most Victorian homes already have a smart meter, and it records electricity use in 30-minute intervals. The trick is knowing which organisation holds which piece of the picture.
Distributor vs retailer: who holds what
Two different parties touch your meter data:
- Your electricity distributor owns the poles, wires and meters in your area. They are the ones who actually collect the interval readings from your smart meter. In Victoria the five distribution networks are Jemena, AusNet Services, United Energy, Powercor and CitiPower. Which one serves you depends on your address, not on who you buy electricity from.
- Your electricity retailer is who you pay. They receive the same interval data from the distributor and surface it in their app or online account, usually with a delay.
A common mistake is ringing the retailer to ask for ‘raw meter data’ when the retailer only displays a summary. If you need the underlying half-hourly file, the distributor is usually the better source. If you just want to see your usage in a chart, the retailer portal is faster.
Find your distributor first
Before you log in anywhere, confirm which network serves your property. You can do this by:
- Checking the ‘distributor’ or ‘network’ field on a recent electricity bill, it is usually printed near the meter details or in the fine print.
- Using your distributor’s own ‘find my distributor’ tool by entering your postcode.
- Asking your retailer’s customer service line directly: ‘Which distribution network supplies my address?’
AER distributor lookup by postcode
Accessing your retailer portal or energy app
Your retailer’s app or web account is the quickest way to monitor home energy use at a glance. Log in, open the usage or consumption tab, and look for:
- A daily or half-hourly chart (some retailers only show daily totals by default).
- A ‘download data’ or ‘export CSV’ button, grab this if it exists, because spreadsheets make patterns far easier to spot than a phone chart.
- A date-range selector so you can compare a summer week against a winter week.
Understanding half-hourly interval readings
Each interval reading is the amount of electricity (in kWh) used in that 30-minute window. When you open the CSV, you will typically see a timestamp column and a consumption column, with 48 rows per day. Look for:
- The evening peak, usually 5pm to 9pm, when cooking, heating and hot water overlap. On a time-of-use tariff this is the most expensive window.
- The overnight baseload, the flat line between midnight and 6am.
- The solar shoulder, the midday dip if you have panels, because generation is offsetting grid import.
When data is missing or delayed
Interval data does not always appear. Common causes:
- Older or non-communicating meters. Some properties still have accumulation meters that only record a total, not intervals. Ask your distributor whether your meter is capable of interval recording; if not, you may be eligible for a meter upgrade.
- Meter configuration. A smart meter can be configured to record intervals but not to send them remotely. The distributor can confirm the configuration.
- Account access issues. If you rent, the account may be in the landlord’s name. You can still request interval data from the distributor as the occupant, but you may need to prove you live there.
- Delays after a retailer switch. Allow a billing cycle for data to flow through to a new retailer’s portal.
If a retailer portal shows a gap, request the same period from the distributor.
Step 2: Install a Home Energy Monitor for Real-Time Tracking
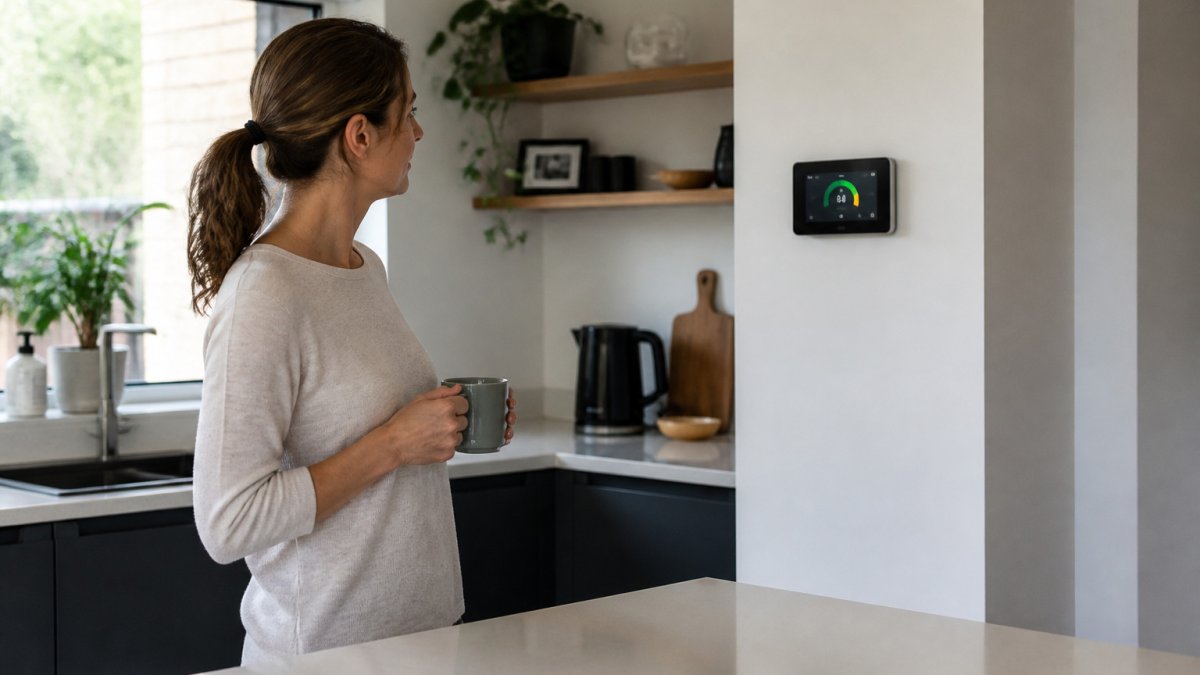
Real-time tracking helps you change habits quickly. Many people start running the dishwasher or pool pump outside peak hours once they see the cost on screen. Some owners with solar also use the display to confirm when their panels are generating more than the house is using.
Step 3: Measure Individual Appliances With Plug-In Monitors
Plug-in monitors are cheap and easy to use. They cannot measure hard-wired appliances like ovens or hot water systems, though. For those, use the whole-home monitor from Step 2 instead.
Step 4: Monitor Solar Power Usage, Export and Batteries
Your inverter app usually shows generation. Your retailer portal shows export and grid use. Comparing both gives you the full picture.
Turning Kilowatt-Hours Into Dollars and Acting on Your Data
A kWh figure means nothing until you attach a tariff to it. The goal here is to translate your interval data into dollars window by window, then act on the biggest numbers. For more ways to cut costs, see proven tips to reduce electricity bills in Victoria.
Read your tariff structure first
Find your electricity plan’s ‘tariff type’ on your bill or in your retailer’s app.
- Single-rate (flat) tariff, one rate for all kWh, plus a daily supply charge. Easiest to calculate.
- Time-of-use (TOU) tariff, different rates for peak, off-peak and sometimes shoulder windows. Peak is typically weekday late afternoon and evening; off-peak is overnight and weekends. The exact windows are set by your distributor, so check your bill for the times that apply to you.
- Controlled load, a separate, cheaper rate for a dedicated circuit such as an off-peak hot water system or slab heater. It appears as a separate line on the bill.
- Demand tariff, a charge based on your highest demand in a window, on top of consumption. Less common for households but increasingly offered.
The calculation, step by step
- Sum the kWh in each tariff window. From your CSV, add the interval readings that fall inside peak, off-peak and shoulder periods separately.
- Multiply each sum by its rate. For example, if your peak window used 6 kWh and your peak rate is $0.35 per kWh, that window costs $2.10 for the day. If off-peak used 8 kWh at $0.18 per kWh, that is $1.44.
- Add the daily supply charge. This is a fixed cents-per-day amount that applies regardless of usage, often around $1 per day, but check your own bill. It is why a low-usage day still costs something.
- Subtract any solar export credit. If you export, your retailer pays a feed-in tariff per kWh exported. That is a separate line, not a reduction in your consumption charge.
Worked example: a day in a Victorian home
Suppose your interval data shows:
- Peak (weekday evening): 6 kWh at $0.35/kWh = $2.10
- Off-peak (overnight and daytime): 8 kWh at $0.18/kWh = $1.44
- Solar export: 5 kWh at $0.05/kWh feed-in = $0.25 credit
- Daily supply charge: $1.00
Daily total = $2.10 + $1.44 + $1.00 − $0.25 = $4.29. Annualised, that is roughly $1,565, but do not annualise a single day; use a week in summer and a week in winter to see the real spread.
Distinguish consumption from supply and time-of-use effects
Two households can use the same total kWh and pay very different bills. The difference is usually:
- When the kWh are used (peak vs off-peak mix).
- How much is fixed supply charge versus variable consumption.
- Whether solar export is offsetting the variable portion.
When you compare plans, calculate your bill under each plan’s actual rates using your own interval data, not the headline ‘typical household’ figure.
Act on the biggest numbers first
Once you have a week of interval data costed out, rank the windows by dollars, not kWh. The largest dollar window is where behaviour change pays off fastest:
- Shift flexible loads, dishwasher, washing machine, pool pump, EV charging, into the off-peak or solar-shoulder window if your tariff rewards it.
- Attack the baseload, a high overnight line often means a second fridge, an old hot water system, or standby loads. A plug-in monitor (Step 3) will identify which.
- Check the plan fit, if most of your usage is overnight, a TOU plan with a cheap off-peak rate may beat a flat plan; if most is in the evening peak, the reverse can be true.
- Re-check after solar or battery, a battery changes which windows you import in, so re-run the calculation after any system change.
Keep a simple spreadsheet: one column per tariff window, one row per day, with the rate in a header cell. Update the rate when you switch plans and the whole year recalculates.
The worked example below applies the tariff rates and calculation steps from the article to one day of interval data.
| Cost item | Usage or rate | Daily amount |
|---|---|---|
| Peak (weekday evening) | 6 kWh at $0.35/kWh | $2.10 |
| Off-peak (overnight and daytime) | 8 kWh at $0.18/kWh | $1.44 |
| Daily supply charge | Fixed daily charge | $1.00 |
| Solar export credit | 5 kWh at $0.05/kWh | −$0.25 |
| Daily total | Sum of the above | $4.29 |
Booking a GridFree Solar Energy Review for Your Home
Reading your own data is a good start. GridFree Solar provides solar panel and battery storage installation services and rebate guidance.
Contact GridFree Solar to discuss solar panel and battery storage installation services.
Frequently Asked Questions
How can I monitor my home electricity usage in real time?
The most direct way is an in-home display or whole-home energy monitor, which clamps onto your switchboard and shows live consumption on a screen or app. Some smart meters also support near real-time reading through a retailer app, although data refresh rates vary by retailer and meter type. Plug-in monitors can add real-time readings for individual appliances. Check your retailer’s app to see what live data it provides before buying hardware.
Can I check my electricity usage through my smart meter?
Yes. Most Victorian homes with a smart meter can view half-hourly interval data through their retailer’s online portal or app, usually after a delay of a day or so. You can download this data as a file and analyse it yourself. Data availability depends on your meter and retailer, so confirm with your provider that your meter is an interval meter and that historical data is accessible.
Are home energy monitors worth the cost?
A home energy monitor is worth considering if you want to see which activities drive your bill and how solar generation, exports and battery use interact. Prices vary by product and quantity, so compare current options and installation requirements before buying. Some monitors need an electrician to fit them to the switchboard. For current pricing or a quote, visit the GridFree Solar website.
How can I find which appliances use the most electricity?
Plug-in power monitors measure the energy used by a single appliance over time, which is useful for fridges, heaters, pool pumps and electric hot water. Run each suspected high-use appliance through a monitor for a typical week, then compare the kilowatt-hour totals. Combine these results with your interval data to confirm where your household electricity is going.
